Wait Wait! Don't Show Me!
Contents
- 1. Your Takes Can Wait
- 2. A Map Is a Bunch of Really Big Choices
- 3. Map Problems are Well-Studied
- Color Breaks Change Perceptual Accuracy
- Clusters Are Partly Made by Shading
- Area Is Not Importance
- Small Areas Can Be Extreme
- 4. Your Brain Loves Tea Leaves
- 5. Maps Can Be Sycophants
- 6. Real Stories Are Complicated
- 7. This Map… It Can Change You
- 8. So, Should You Look?
Modern elections all end the same way: Early results come in, someone makes some sort of map, and the map gets passed around online. AI has made this easier than ever, inundating us with a flood of vibe-coded statistical charts the moment that any data exists: “Claude, show me a visualization of San Francisco voting patterns, make no mistakes.”
All these maps tend to look the same: precincts, counties, or states, colored by how they voted or something like that, with little justification for any of the choices that went into creating the map. Indeed, with AI, sometimes no choices were made at all.
Either way, people look at these charts, see something, and develop some interpretation of what they saw, with varying degrees of causal implication:
- This neighborhood is “progressive”.
- That county flipped, reflecting a shift in political sensibilities.
- This area was reached by some specific campaign, validating its strategy.
In the post-538 Kornackicam world where we have been trained to love looking at charts, I know that might sound absurd, but bear with me.
I’m not claiming that anything is wrong with maps, per se. What’s wrong is what happens in your head when you look at a chart with no question in mind, and the trajectory of a chart once it gets released into the online wilderness.
The first problem makes you wrong, which is all well and good, but the second makes other people wrong, and both warp your view of the world in ways that you likely cannot expect or even know.
At the end, I’ll give you some basic suggestions for how to look at a chart without hurting your brain.
1. Your Takes Can Wait
Election results will change throughout the canvass period [the time after Election Day when the ballots are counted] as vote-by-mail ballots, provisional ballots, and other ballots are processed.
An easy-to-address Bad Thing relates to the urgency with which people want to Have Takes around election results. You ought to feel comfortable waiting until results are final before looking at any data or having any Takes about what happened.
Ballots get counted in an order set by how and when people voted, and how and when people vote depends on who they are. Studying California, Li, Hyun & Alvarez found that “young voters and non-white voters are more likely to cast types of ballots that are counted after Election Day.” This is especially true for local elections in San Francisco, where it’s now conventional wisdom that the early vote counts are markedly different from the later ones.
An early map doesn’t show you an approximate version of the truth that will be revealed when all the ballots are counted - it shows you a sharp picture of a biased subset which may be entirely unrepresentative of the electorate as a whole.
2. A Map Is a Bunch of Really Big Choices
A single map is but one of an indefinitely large number of maps that might be produced for the same situation or from the same data.
- Mark Monmonier, How to Lie with Maps
Okay. Suppose all of the results are in, and we’re eager to make a simple map of election results so as to Have Takes. There are two basic choices (among many) that must be made:
-
We have to pick a color scheme.
- Do we use two colors that meet at 50%, so that every place has to pick a “side”?
- Do we stretch the scale to fit this year’s range, so that tiny differences look huge?
- Do we shade by margin, or just by who won?
-
We have to choose the sizes of elements that are displayed on the map.
- Do we draw each place at its real size, or by how many people actually live there?
Every one of these things can be a sensible choice, but it is a choice. This choice is very much not irrelevant in terms of how people will interpret it.
Here’s a fake example, which illustrates some of these choices. This is a fake country with 194 counties and two big cities, voting on a ballot measure that Yes won with 59% of the vote.
All four maps use the exact same votes, but differ in some choices on how to display them.
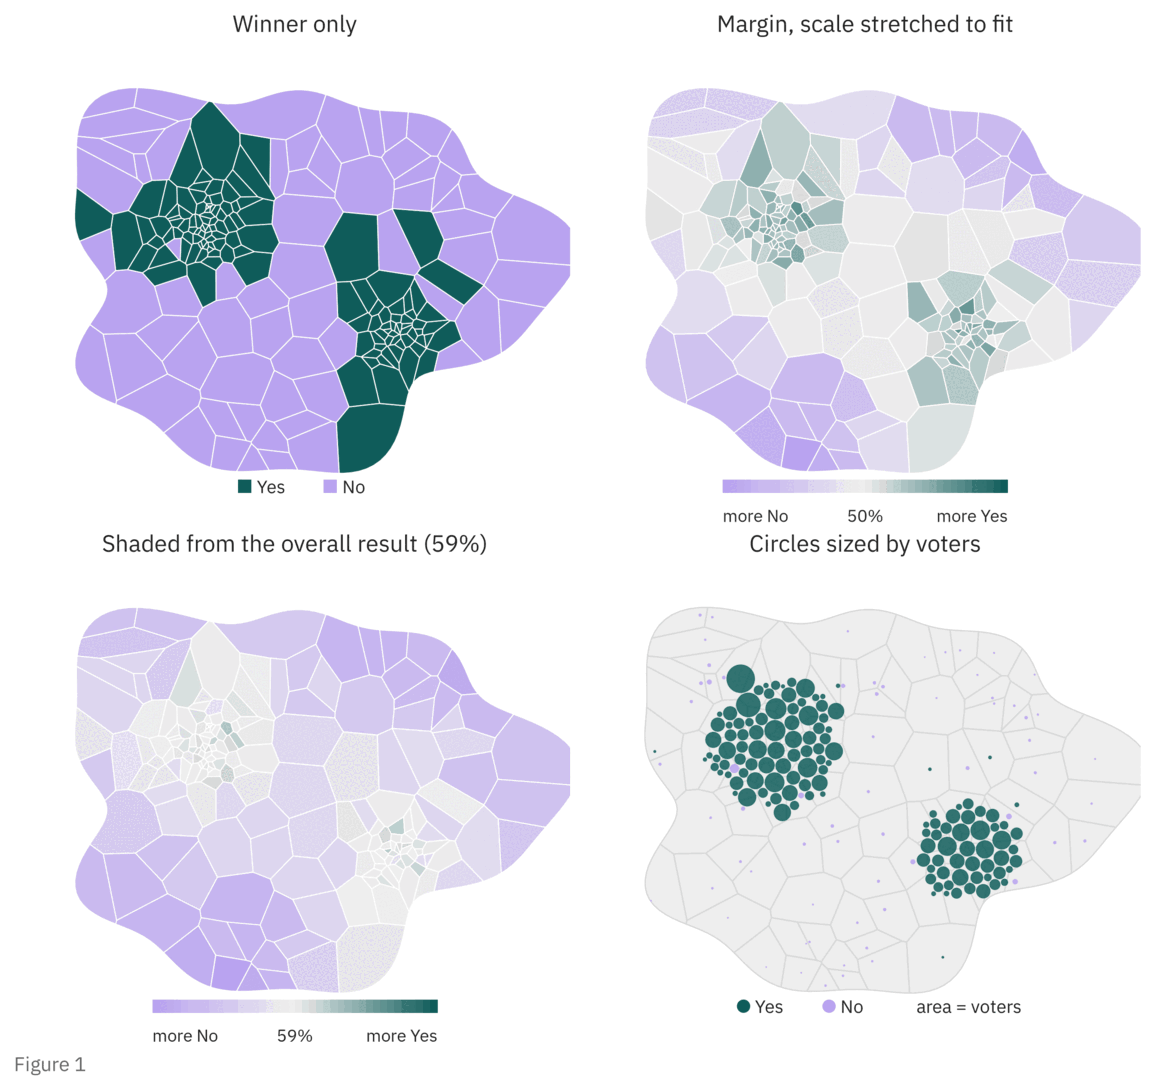
- If we color each county by who won, it looks like No ran away with the thing, since No carried about 70% of the land.
- If we shade by margin and stretch the scale to fit, the countryside looks like a sea of No, and the cities look lukewarm at best.
- If we shade from the overall result instead, the two cities that actually won it for Yes basically disappear.
- Only the last panel of Figure 1, with circles sized by voters, tells you where the votes actually were, and correctly reflects different voting patterns in the cities.
3. Map Problems are Well-Studied
I’m not just making these issues up - there is a long history of research into the specific psychology of how people interpret maps_._ Here are a few examples that make a huge difference in how we need to think about their creation and use.
Color Breaks Change Perceptual Accuracy
To make a map like this, you have to break up the data, and each part gets its own color. Picking color breaks is the choice of where to break up the scale. With quantiles, every color gets the same number of places.
In a study of people reading a series of maps of cancer rates, Brewer & Pickle found that two common ways of picking color breaks produced responses less than 70% as accurate as if the colors were chosen based on quantiles.
That’s pretty remarkable to me: a poor but sensible choice of how to break up and display data can completely destroy the ability for people to extract information.
Clusters Are Partly Made by Shading
Shaded maps sit near the bottom of Cleveland & McGill’s ranking of how accurately people read different kinds of charts. This has something to do with our visual acuity - “values group together because we cannot visually differentiate them.”
To be fair, color is not useless for coding in general, it just goes wrong when applied to spatial regions. Cleveland, Harris & McGill show how badly that can go. They showed people county maps where the red and green areas were almost exactly the same size, and about half of them still said there was more red, with twenty percent saying more green. Although the red and green areas were actually equal, they didn’t look equal.
A continuous ramp can do worse than blur an area: it can invent one. Kovesi notes that color maps “have perceptual flat spots that can hide a feature as large as one tenth of the total data range”, and that they “may also have perceptual discontinuities that induce the appearance of false features.”
That is: the “region” you noticed might just be a fact about how the map creator decided to pick colors. You can watch it happen in the above figure - the second and third panels are the same votes under a different ramp, and your eye finds different regions in each.
Area Is Not Importance
Maps often paint each place in proportion to how much land it has - like an actual map of the geography. Your eye reads that land as weight, which is true in terms of land area, but not in terms of anything related to voting.
In the words of Gastner, Shalizi & Newman: “Conventional maps of election results can give a misleading picture of the popular support that candidates have because population is highly non-uniform and equal areas on a map may not correspond to equal numbers of voters.”
Small Areas Can Be Extreme
The most interesting places on a map are very often just the smallest ones. Howard Wainer’s “The Most Dangerous Equation” has the classic example: the US counties with the lowest kidney-cancer rates and the ones with the highest are both mostly small rural counties, because statistics for small populations swing around a lot more.
The problem is actually pretty generic. Gelman & Price’s paper on this has, in my opinion, one of the best title in statistics, which tells you pretty much all you need to know: “All maps of parameter estimates are misleading.” As per this paper, there’s really not a way of getting out of this basic trap with any single map.
To give map authors generalized grace, none of these maps are “lying” as such. They just have a bunch of important implicit choices that create them and can completely determine how they are interpreted. If they are swept under the rug, then the opportunity for people to be misled is extreme.
4. Your Brain Loves Tea Leaves
“Exploratory data analysis is detective in character. Confirmatory data analysis is judicial or quasi-judicial in character.”
“Many of the indications to be discerned in bodies of data are accidental or misleading. To accept all appearances as conclusive would be destructively foolish.”- John Tukey, Exploratory Data Analysis
Now to the important part, which is about how our brains are rigged to search for patterns that may not exist.
The best evidence I know for this comes from Zgraggen et al. They gave students a visual analysis tool and some datasets where the researchers already knew the true relationships in the data. The students were left to their own devices in exploring the data, and reported their conclusions to the researchers.
Over 60% of what they reported was false. Dang. Their conclusion is the main takeaway of this post: looking is testing, and if you look a bunch of times, you run straight into the multiple comparisons problem. That is: run a bunch of tests, and some of them will look interesting even if nothing is going on.
Every time your eye scans a chart and something “looks interesting,” you’re running some sort of test against your brain’s intuition for what’s interesting. The problem, of course, is that you didn’t record it in any way that lets you keep track of what’s going on or relay it to anyone else. Hell, you might not even be able to do this - it’s all happening subconsciously.
Scan a map with five hundred counties and, well, that’s a lot of tests. A lot of tests that you simply can’t stop yourself from performing without some sort of mental preparation.
This is exactly the sort of thing that experimental preregistration exists to prevent in science. A responsible scientist will write down what they will test before they look at the data.
In the garden of forking paths that Gelman & Loken describe, you don’t even need to try to fish for results. It’s enough that “had the data turned out differently, [you] could have done other analyses that were just as reasonable.” Unguided, we search for patterns: if some other place had stood out, you’d just have a story about that place instead. The garden of forking paths is all of the other analyses you could have done instead.
Fortunately, one fix in the research literature is pretty simple. A lineupBuja, A., Cook, D., Hofmann, H., Lawrence, M., Lee, E.-K., Swayne, D. F., & Wickham, H. (2009). Statistical inference for exploratory data analysis and model diagnostics. Phil. Trans. R. Soc. A, 367, 4361–4383. https://doi.org/10.1098/rsta.2009.0120Wickham, H., Cook, D., Hofmann, H., & Buja, A. (2010). Graphical inference for infovis. IEEE TVCG, 16(6), 973–979. https://doi.org/10.1109/TVCG.2010.161 hides the real chart among a bunch of fakes made by shuffling the data around. If you can’t pick out the real one, then whatever you saw in it probably isn’t evidence of anything.
Buja, A., Cook, D., Hofmann, H., Lawrence, M., Lee, E.-K., Swayne, D. F., & Wickham, H. (2009). Statistical inference for exploratory data analysis and model diagnostics. Phil. Trans. R. Soc. A, 367, 4361–4383. https://doi.org/10.1098/rsta.2009.0120Wickham, H., Cook, D., Hofmann, H., & Buja, A. (2010). Graphical inference for infovis. IEEE TVCG, 16(6), 973–979. https://doi.org/10.1109/TVCG.2010.161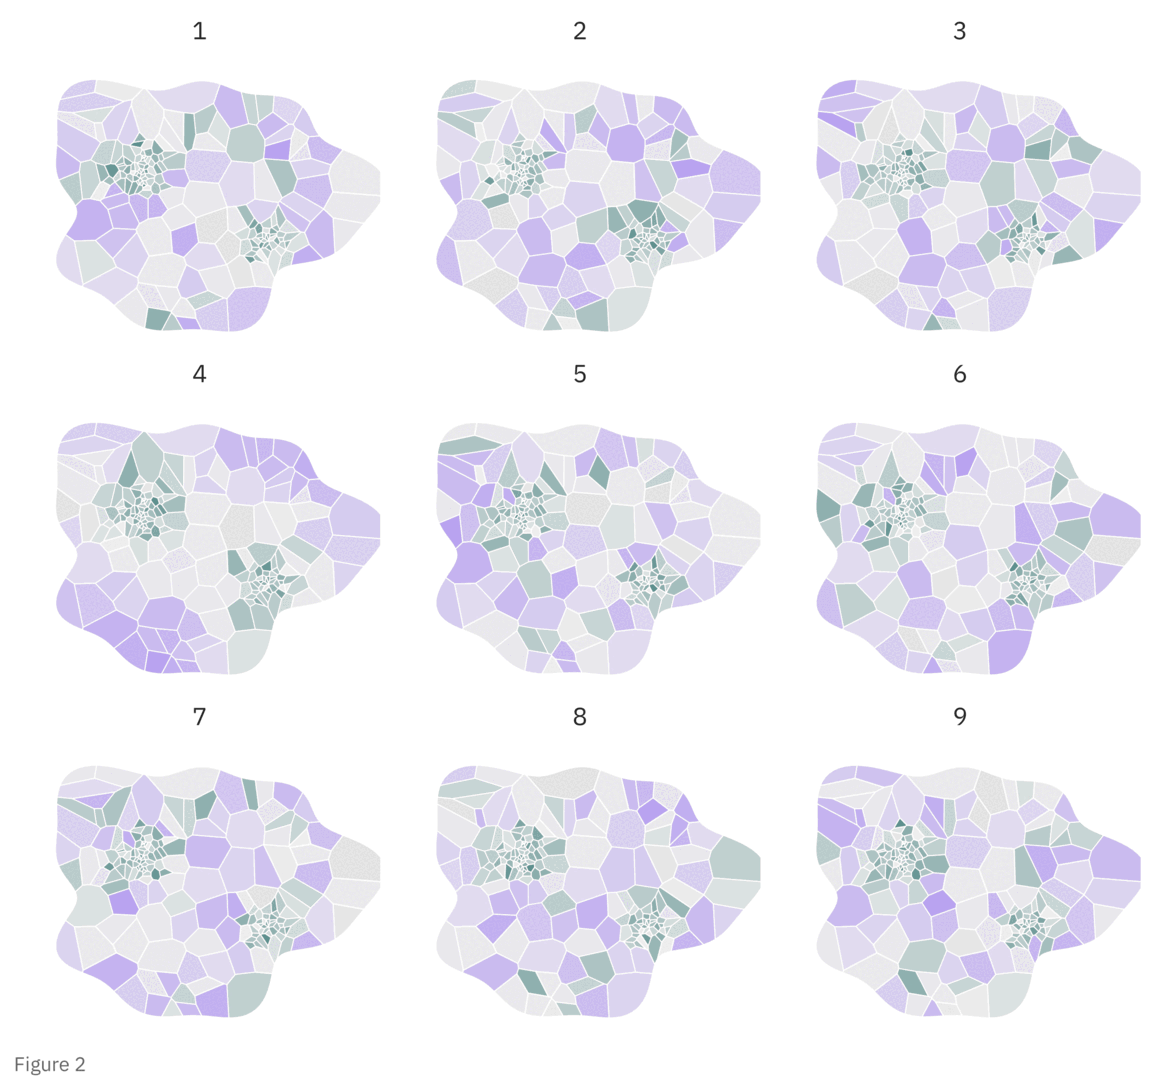
If you did pick out the real one, good for you! It means the pattern there is probably real, but now you need to know why it’s there.Lineup answer: the real map is Figure 2, panel 4.
Lineup answer: the real map is Figure 2, panel 4.5. Maps Can Be Sycophants
Pictures that emphasize what we already know—“security blankets” to reassure us—are frequently not worth the space they take.
- John Tukey, Exploratory Data Analysis
There’s another psychological defect that works against our ability to process maps or statistical charts in general - confirmation bias. People tend to try to interpret new information in ways that align with their preexisting beliefs, to the degree that they will contort the information to incorrectly align with those beliefs.
For example, Xiong et al. asked people to estimate correlations in normal X-Y scatterplots. The impact of a prior belief around the relationship between the variables was stark: when viewers believed that two variables should have a strong relationship, they overestimated correlations between those variables and underestimated them by a similar amount when they expected none.
This also influences how you pay attention when viewing a map. Work on weather maps by Hegarty, Canham & Fabrikant found that where people looked was driven primarily by top-down factors (task and domain knowledge).
For a political map, the domain knowledge is whatever prior belief you have around how politics tends to work. This means that you’re going to pay more attention to parts of a map that you believe will support some prior narrative around politics - this doesn’t necessarily lead you to truth.
6. Real Stories Are Complicated
Pretty much every reading of a map like this ends in some sort of explanation: this place voted that way for such and such a reason. A map, by itself, simply cannot support any of that broader extrapolation, which touches the difficult problem of inferring causality.
On a basic level: a map of places can’t tell you about the people in them, because, well, a place is not a person. This is called the ecological fallacy, and its founding paper, Robinson, is clear about its consequences. He showed that in 1930 the correlation between being foreign-born and being illiterate was slightly positive for individuals and strongly negative across states. Then he asked whether correlations across places can stand in for correlations across individuals. His answer was blunt: “They cannot.”
Most relevant to this is the common desire to do analysis of campaign effectiveness based on election results. Consultants at least partially make their money off of pseudo-scientific narrative generation associated to the Why of which campaigns win or lose.
The tactics of a campaign must, of course, influence the outcomes in some way. The problem is that a result map that is correlated with a particular campaign with a particular tactic cannot say much about whether or not that campaign did a good job.
The only way to test this sort of thing is via an actual random experiment, which isn’t impossible, just rare. Rogers & Middleton found that mailed ballot guides had sizable effects on vote margin for nine of the twelve ballot measures. This was a random experiment, which does show something. However, campaigns don’t pick where to work at random, so the simple correlation of outcomes to campaign activity doesn’t show anything meaningful.
7. This Map… It Can Change You
The cost of map misinterpretation isn’t just getting a fact wrong or developing a wrong story around how the world works; it can warp your sense of self in ways that stick around.
Rutchick, Smyth & Konrath found that “colored maps depicting electoral results may exacerbate perceptions of polarization, rather than merely reflecting them,” and that “[t]hese differences occurred even in the presence of numeric data.”
Indeed, as in Furrer et al., people who saw two-category election maps in the typical Red/Blue Republican/Democratic shading overestimated how lopsided places were. The authors concluded that the two-category maps, not the colors themselves, did the damage, and moreover that they made people feel like their vote mattered less.
That last bit is pretty important, I think. These sorts of maps lead people to feel disempowered and alienated. This was not some intentional thought on behalf of the viewer or the person making the chart - it happened to them while they were “just looking.”
8. So, Should You Look?
“To fail to collect all appearances because some—or even most—are only accidents would, however, be gross misfeasance deserving (and often receiving) appropriate punishment.”
- John Tukey, Exploratory Data Analysis
Exploration is private hypothesis generation. It’s scratch paper. The part Tukey’s framing doesn’t cover is the present inevitability of that private scratch paper getting screenshotted and shared.
Researchers call the flattening of many audiences into one “context collapse”. They meant it about how people present themselves, but it describes what happens to a chart as it moves through the world. The person who made it knew it was early, or rough, or one of several ways to draw the data - it’s harmless, they think, to put this out into the world. Three reposts later, though, it’s the map, and it’s being treated as a real analysis with no caveats.
Earlier, I said we might be better off never look at maps like this at all, but really - sometimes it’s okay. Here are some basic suggestions that will help keep you safe in doing so:
-
Write down what you expect before you open the chart. Seriously. Write it down on paper. This experiment had people record their expectations before exploring a visualization. Those who did so made 21% more correct inferences along with 12% fewer false discoveries. This works because you are priming yourself to look for a specific set of patterns, not generating them based on the assumption that they must exist.
-
Have a question in mind that the chart can actually answer or at least support some hypothesis. Most questions about why people did something can’t be answered by any picture of what they did - it almost always requires a more thorough and qualitative analysis to develop a theory.
-
If you see a pattern, be suspicious of how good it feels and whether or not it fits with your prior intuition. Ask yourself whether a different color scheme or sizing scheme would have shown it, and whether you’d be able to pick it out of a lineup of shuffled fakes.
-
If you share a chart, be very clear about what it is. Most importantly, PUT THIS IN THE CHART ITSELF. If you don’t include methodology and sources in the actual image that you are sharing, that context will get lost as it gets passed around online. Some things to include:
- Is it early or final?
- Which of the many possible drawings is it, and why?
- Is this an exploration or a conclusion? If the latter, what is the conclusion?
- What are the sources for the data? What choices were made in producing it?
-
Remember: at the end of the day, it’s fine to not make a claim at all if it’s not backed by available evidence.
Election maps are just the most obvious example. There are a lot of charts out there that you come across without any real reason to be looking at them, and all of this applies to those, too.
All of the papers cited in this post are collected here.