I Have More Maps & I Must Scream
Contents
Once More Into the Breach
My prior post on the flaws of early return pontification and the harm of chart-gazing was nonspecific, meant as vague-posted advice I could point to in order to avoid repeating the same (objectively true) facts:
- Early election returns are not representative of final counts, so analyzing necessarily introduces errors.
- Maps that present data, as such, introduce perceptual and psychological issues that can distort an intended message or create false beliefs.
- Looking at a lot of maps (or charts, or whatever) without an intent will cause you to see patterns that may or may not exist (like a Bible Code or reading tea leaves).
- A map of voting patterns in places cannot tell you how individual people behave.
- Looking at certain maps can psychologically prime you to view the world in unrealistic and negative ways.
Perhaps I didn’t do my part in writing this piece early enough or having enough of an audience for it to be absorbed into the zeitgeist. Either way, reality has now compelled me to write more directly about the real political economy associated to ignoring these facts.
To wit, Chris Arvin wrote a piece for The Standard, The story of San Francisco’s November election, in 7 maps, that seems to ignore the serious implications of the above facts. Notably, they are also the creator of Election Map SF, which allows users to generate a number of arbitrary charts (not just maps) associated to San Francisco elections. Both, sadly, present a possibility for genuine harm to the public.
Let me be clear[Obama voice]. : I believe wholeheartedly that the creator of this website has no ill-intent or even that they have any bad political sensibilities. Given that, the most charitable reading of the creation of this website and the publication of this article is that they are simply naive about the impact of data visualizations and the political economy of putting this sort of thing in The Standard.
[Obama voice].Election Map SF is a Bad Thing
First, I am going to go into some technical bits about why, specifically, this website and the reporting in the article is flawedI’m even going to be a little nice and largely ignore my suspicions that much of this was made with AI, something I think should categorically stay away from statistical analysis. . I’ll line them up with some things mentioned in my other article.
I’m even going to be a little nice and largely ignore my suspicions that much of this was made with AI, something I think should categorically stay away from statistical analysis.Takes Can Wait
This article was published before the final vote counts are in, though they are complete enough to likely be reflective of the final winners. The analysis itself was probably shaped by peeking at results before that even happened, based on generating these maps from the counts as they came in.
Early returns for San Francisco are systematically biased - the general belief is that ballots counted later skew more “progressive”, and this conventional wisdom is baked into the horse-race narratives concocted in the days after San Francisco elections.
You can watch the problem happen inside the article itself. The article says 55% of voters went for Wiener; the map right below it says 54%. It also says the precincts “next to the park” voted 58% no; the map says 59%.
These specific numbers may seem inconsequential in absolute terms, but as a matter of statistics: they’re not. The direction of this error may be somewhat predictable, but its scale is not. This applies not just to these margins, it fits all non-random data that comes from preemptive analysis.
Just don’t do it. - Bad Nike
Everyone Gets a Bible Code
Even if the data was complete, the problem with this sort of stuff doesn’t go away. There is an egregious problem associated to the existence of the Election Map SF tool at all, which broadly supports the misguided, harmful impulse to do unguided exploratory data analysis.
This tool does the worst version of this: it allows someone to generate a practically infinite number of comparisons between two things, under the guise of allowing for Fun Data Exploration. This is a very bad thing to enable.
The comparisons tool lets you put any race, measure, or census number on each side of a chart, where it then draws each of the precincts as a point. It also gives you a number for how correlated the two are, and an arbitrarily-selected name for the strength of that correlation: “Little, if any,” “Low,” “Moderate,” “High,” or “Very high.”
By my estimation1693 variables across 17 elections, 45 ACS variables corresponds to 1738 possible axis choices. (1738) * (1738 - 1) / 2 = 1509453. You can get the counts of the variables from the website itself. Some of these are not real questions: for example, in a race with two people, the two shares are perfectly correlated. There aren’t too many of these - 10,728 from the same race, and without them there are still about 1.5 million. , there are roughly 1.5 million pairwise comparisons that this tool presents to you. It should be clear that randomly poking around this massive set of pairs will necessarily produce spurious correlations, especially for spatial data. Never mind the fact that correlations alone aren’t useful for causal inference.
1693 variables across 17 elections, 45 ACS variables corresponds to 1738 possible axis choices. (1738) * (1738 - 1) / 2 = 1509453. You can get the counts of the variables from the website itself. Some of these are not real questions: for example, in a race with two people, the two shares are perfectly correlated. There aren’t too many of these - 10,728 from the same race, and without them there are still about 1.5 million.To illustrate this, I assigned each precinct in SF a random number, then made those numbers change slowly across the city so that places near each other got similar numbers. Nothing in the numbers means anything at all, they’re just connected because of spatial proximity. A typical one of these maps gives a correlation of 0.4, a “Low,” and the best of them gives -0.81, a “High.”
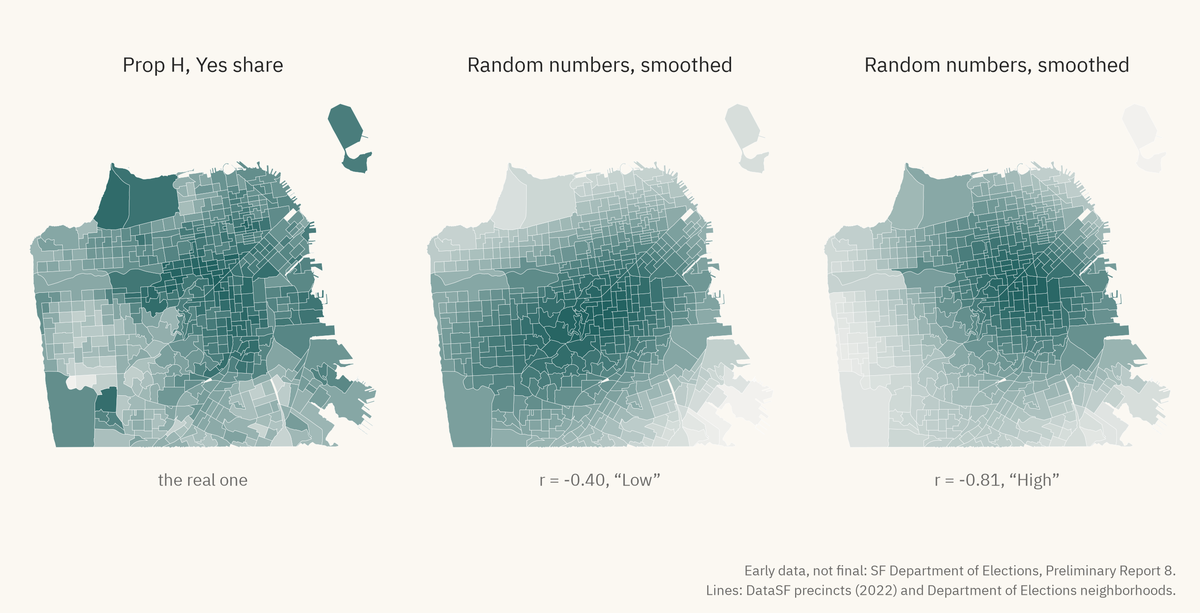
As you can see, there are a lot of correlations that can show up in this sort of data that come simply from the fact that it’s spatial.
More broadly, this exploratory process takes us into the dark and spooky garden of forking paths, while also amplifying the ecological fallacy. This tool provides people with the ability to poke around to find correlations that, as I just showed, can mean absolutely nothing.
Color Breaks Create Clusters
The choice of color breaks in the shading of a map can completely destroy the ability of the map to convey any information, or create perceived information where there is none.
Map 6 in the article shows Prop H, a measure to fund Muni service with a new parcel tax. All but 3 of the precincts are some shade of green, with more green where more people voted Yes; the 3 where No won get a different color, and the map says only “Yes 74%” and “No 26%.”
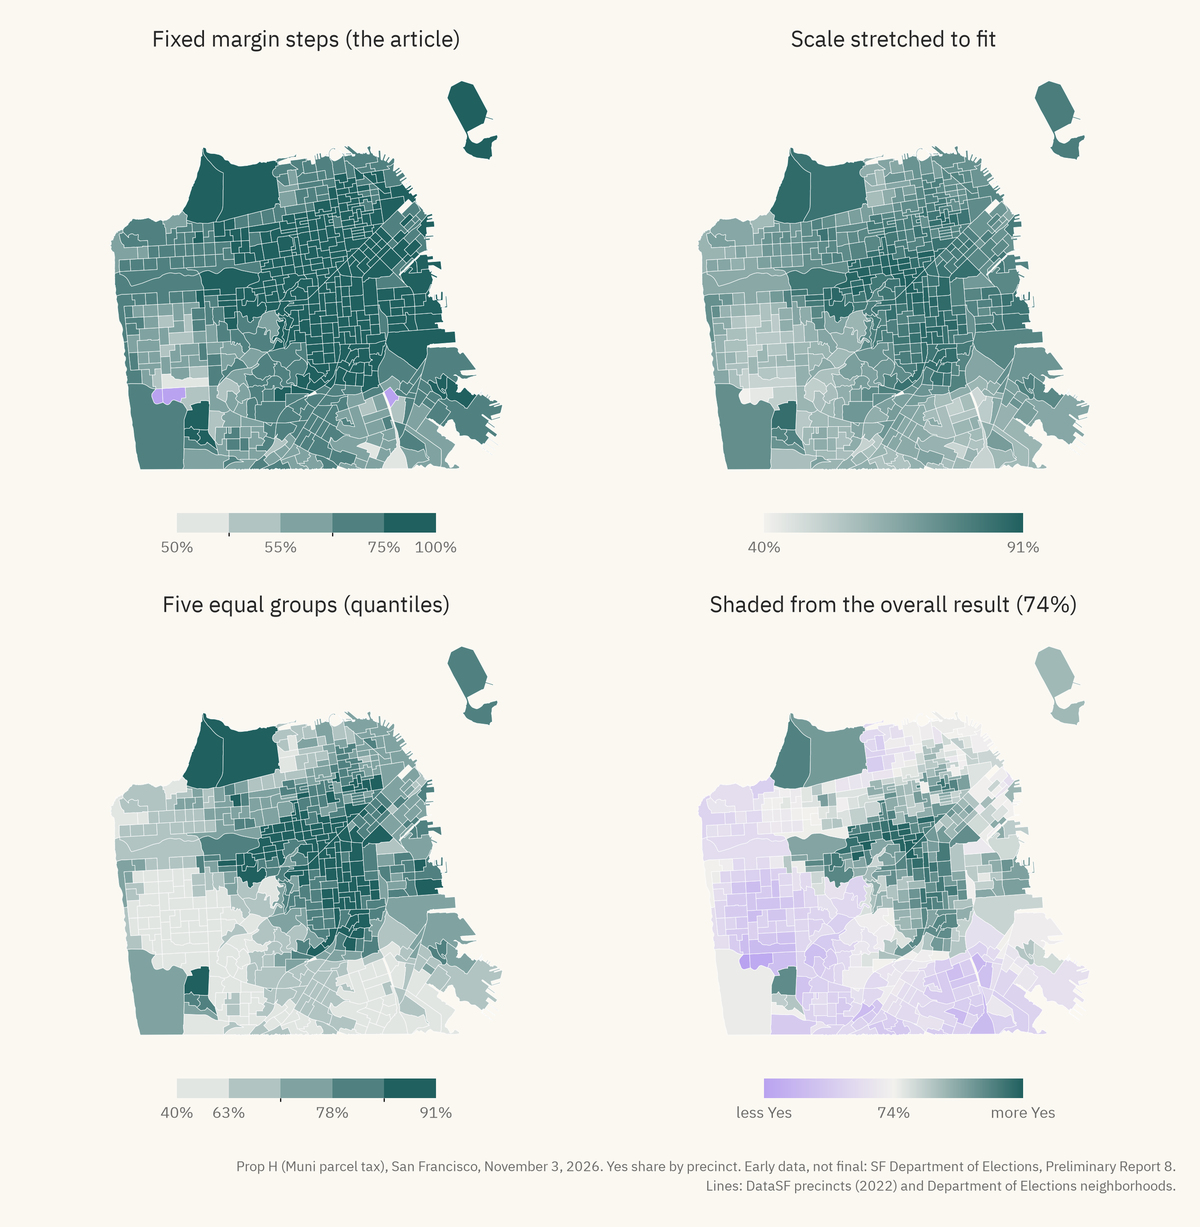
I generated some maps using the same data: The first panel is the one the article uses: the color steps by margin, and 256 precincts, half of the city, get the top color. With five equal groups as in the figure below it, 102 precincts get the top color. If you stretch the scale to fit this one race as in the top right, the city turns into a lot of middle shading with no clear lines at all.
The bottom right shades from the overall result. At that point, the city breaks into two regions: a green middle, and a “less Yes” region along the sea and the bottom of the map. In that panel, 238 precincts are on the “less Yes” side, but Yes won almost all of them.
Area is Not Importance
Map 4 in the article, “Prop. 40 results in SF by neighborhood,” colors each neighborhood by who won it, and the end result looks almost entirely green.
The article does put circles on top, but nothing on the map says what the size of the circles means, which doesn’t help much to correct for the basic problem in coloring the map this way.
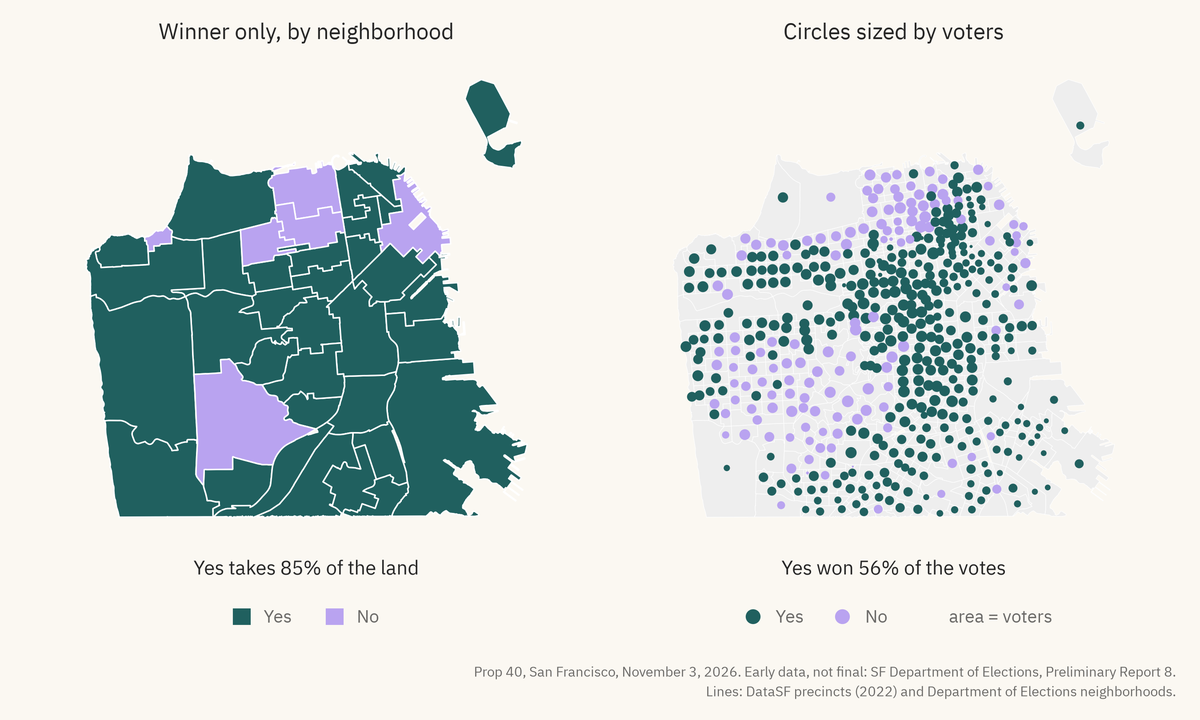
Again, I regenerated the figures using the same data, but aggregated and displayed it differently.
On the left, as in the article, each neighborhood gets the color of the side that won it, and Yes takes 85% of the land. As you might be aware, land doesn’t vote - people do.
On the right we have something a bit more human: each precinct gets a circle sized by the number of voters, and since precincts are drawn to have about the same number of people, the circles come out about the same size. The big parts of the city with few people in them turn into a few small circles, or none at all.
The obvious visual differences in these two charts speak to how much these choices can create different narratives. The leftmost figure makes it seem like the No support is entirely marginal and concentrated in a few areas, reinforced by things like the area containing Golden Gate Park of greater visual importance than places with lots of non-bison inhabitants.
Small Areas Are Extreme
Map 2 in the article sorts precincts into groups based on census data: “Mostly white precincts,” “Mostly Asian precincts,” and two groups by median income. The story being told here, clearly, is something about How Different Races Vote, one entirely unsupported by this map.
These numbers are estimates from the American Community Survey, which the Census Bureau runs every year. Each one comes with a margin of error, because it is based on a subset of people and not everyone. The article takes those estimates, gives them to precincts by how much land they share, and puts a line at 60%Why 60%? Who knows. .
Why 60%? Who knows.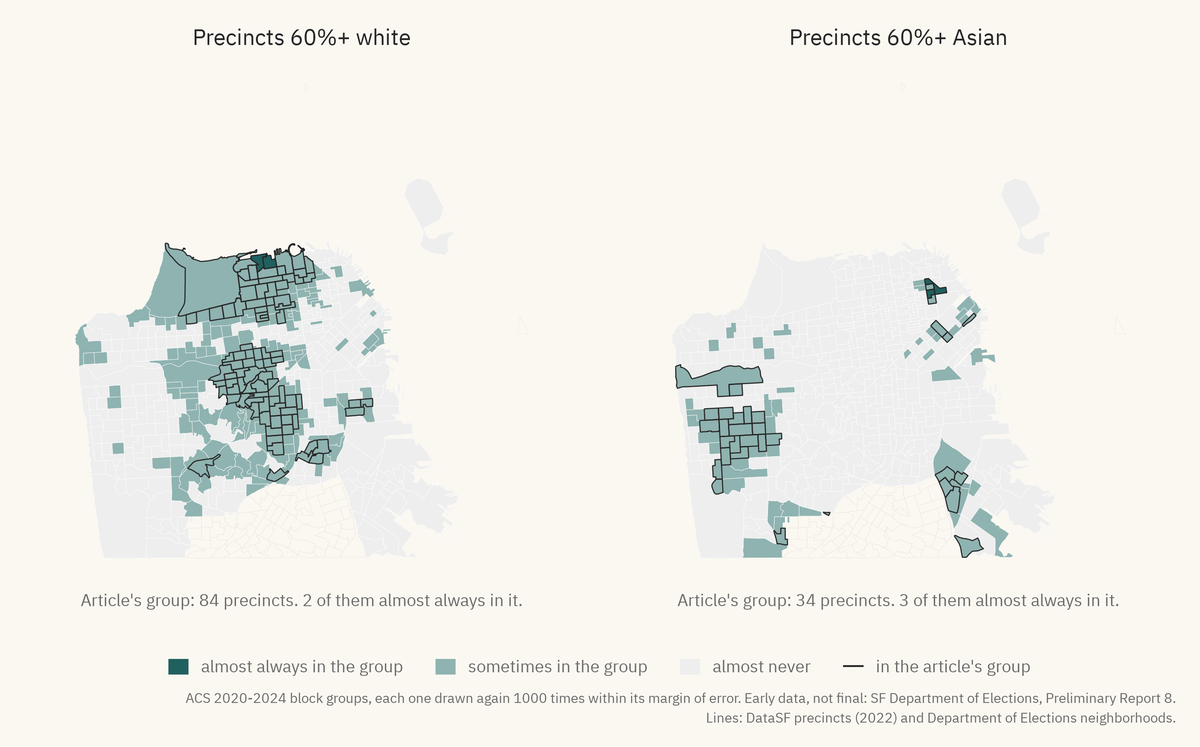
For the racial data used in the article, the margin of error is pretty big. For a typical one of the “mostly white” precincts, the share of white people has a margin of error of about 16 points. Of the 84 precincts in that group, 79 are closer to the 60% line than their own margin of error.
The “mostly Asian” group is worse: 31 of 34, with a typical margin of about 23 points. If you draw these estimates again within their margin of error, only 2 of the 84 “mostly white” precincts are almost always considered “mostly white”.
As per Gelman & Price: “All maps of parameter estimates are misleading”, and this is no exception. The map in the article shows a clear set of “mostly white” precincts, but the reality is that this classification itself is ambiguous.
The Standard Shouldn’t Be Standard
I hope at this point you see the technical problemsSome of them. There are a lot more. associated to this sort of analysis per se, but there’s real political content on top of that associated to posting it in The Standard.
Some of them. There are a lot more.The Standard is an astroturf publication created in 2021 by the billionaire venture capitalist and long-time shanda Sir Michael Moritz. This guy is as far from one of the mythological “good billionaires” as one could imagineI find it a personal affront that he shares this “Sir” with the noble Patrick Stewart (RIP). , spending huge swaths of his fortune advancing his terrible agenda in San Francisco.
I find it a personal affront that he shares this “Sir” with the noble Patrick Stewart (RIP).To start, he co-founded the dark money group TogetherSF (which chimerically merged with Neighbors for a Better San Francisco🙄, now Blueprint). The intent of this group was never particularly subtle, even before various leaked documents said so explicitly - shift San Francisco politics to be friendlier to rich VC types by throwing global-scale money into local politics.
Per those leaked documents, their plan runs through 2028:
- Launch and win 2–3 ballot measure campaigns.
- Win supervisorial races.
- Back the 2024 and 2028 mayoral races.
- “Grow and sustain [a] movement of community dissatisfaction”
- All of this aimed at a government “failing at delivering basic services.”
Those in SF may recognize the fingerprints of these ideas in several of the ballot measures just passed (A, D, E, F, notably).
You can read more about the well-laid, anti-democratic plans of these groups to remake San Francisco in their image, using massive amounts of money donated by rich guys like Moritz. The leaked deck puts numbers on it: 11 million more pledged, for 11 million more to match the pledge for $22.4 million through the 2026 election.
The Standard itself is part of this big, well-funded project, launched in 2021 and entirely funded by $10 million from Moritz. It fits neatly inside the plan to reshape society according to the whims of this guy and his ilk - like Elon Musk’s purchasing of TwitterSorry, X, The Everything Platform. , the creation of The Standard is meant as a way for some schmucks to control the flow of information in a barren media ecosystem and propagandize their unpopular positions.
Sorry, X, The Everything Platform.Of course, The Standard employs a lot of good people - it’s hard to begrudge people taking a job at this place when the local journalistic ecosystem (never a source of easy riches) has been so thoroughly hollowed-out.
I certainly won’t say that everyone cashing checks is part of some right-wing technofascist conspiracy — people have bills to pay, and it’s not like you have much of a choice in terms of who your billionaire benefactor is. Indeed, much of the content in The Standard is completely above-board, and so I understand the rationalization of an employee doing say, food reporting, thinking that they’re removed from the broader evil of the institution.
To the Left, to the Left
We’re left with a question: Why would a paper with a political project want you looking at maps of your own city?
Well, look at what these maps end up accomplishing in the context of an article like this. A political claim is accompanied by a picture of every precinct, and the paper gets to say what the picture means while it reads as an objective measurement. Map 7, for example, was apparently a “landslide,” and the no votes are mostly in the Mission. You can come up with some obvious narratives around this yourself, surely.
Maps are easy to make, easy to pass around, and they trick us into thinking that they’re scientific evidence to be taken at face value. That legitimizes the source (The Standard) as a neutral arbiter of The Facts, “mathwashing” their political project.
There’s a more subtle and sinister thing: as I wrote in the last piece, maps like these make people feel like there’s more polarization than there actually is, and make them feel like their vote matters less.
Someone on the left, in general, should be deeply suspicious of The Standard’s desire to publish their content - especially if it has a political bent, and especially if it is something that appears neutral like data analysis. It should probably be taken for granted that anything political they publish is ultimately serving the broader goals of the rich tech guys who control The Standard.
If this is so clearly the case, then why would someone well-meaning help advance these goals? Mens rea is difficult - I cannot know what goes on in the minds of others, but I can state clearly that what’s going on doesn’t require intentObligatory “The purpose of a system is what it does”, or something. .
Obligatory “The purpose of a system is what it does”, or something.The mapping tool was built “for fun and curiosity”, and I’m sure this article comes out of the same impulse. The problem is, unfortunately, downstream of the creator - naivety at the source feeds the machine at the bottom.
So, Dear Reader
With all that expunged from my brain, now what?
Well, if you happen to be the creator of Election Map SFOr anything like it - this is not the only such site. AI has allowed people to vibe code equivalently harmful websites in a matter of minutes. : take your website down.
Or anything like it - this is not the only such site. AI has allowed people to vibe code equivalently harmful websites in a matter of minutes.I’m not kidding. You’re not providing a helpful tool, you’re not improving the discourse, you’re not helping with anyone’s understanding of anything, and it’s genuinely the case that the mere existence of this thing has negative consequences. It is irresponsible to maintain such a thing, and I would hope that this would be taken seriously.
If you’re just an innocent bystander, well:
- Don’t use this tool or anything like it.
- Don’t get an AI to make one for you.
- Continue to be skeptical of anything The Standard puts out.
- If you’re on the left: don’t write for The Standard. Unless you’re about to starve or something, in which case I promise to help you set up a GoFundMe.
- Follow my advice about avoiding the trap of chart-gazing. Your brain and broader political sensibilities will thank you.
- Do something politically and intellectually productive. I’m happy to provide book recommendations.